Market Maps
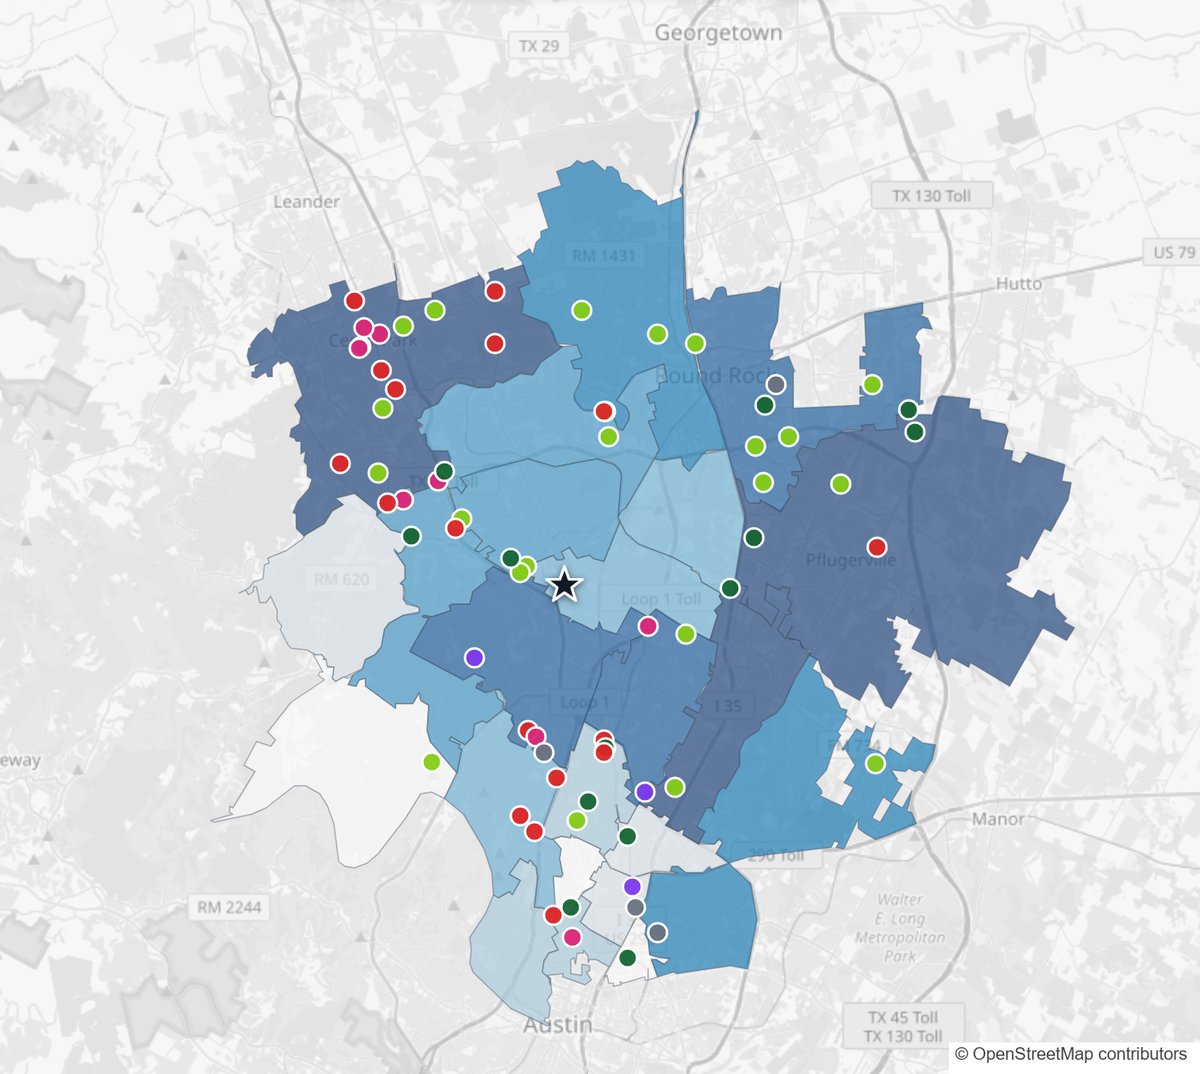
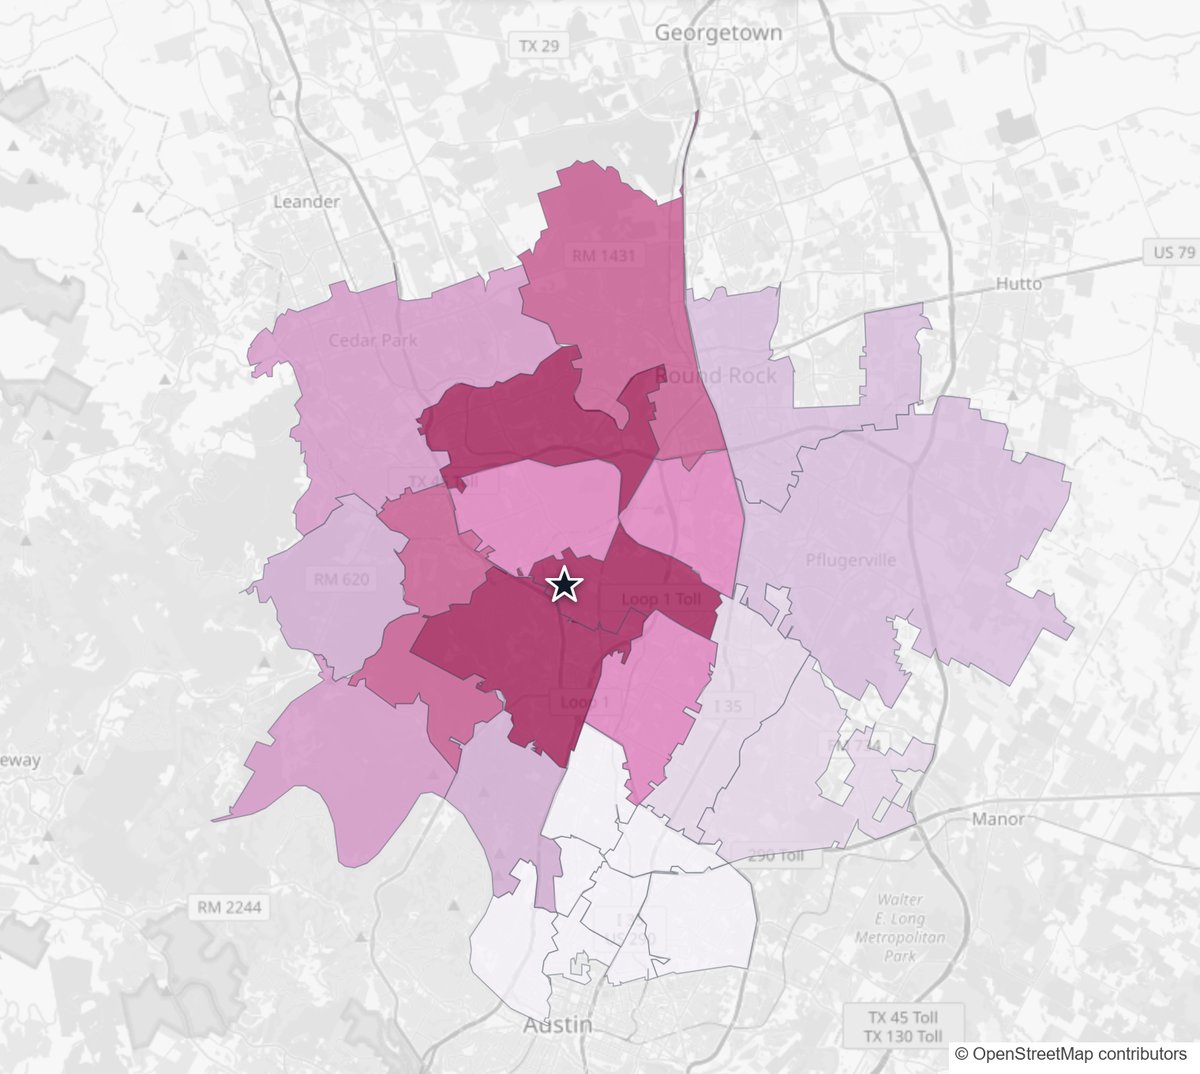
Type an address, choose a radius or a drive time of up to an hour, and the map fills in. Shade it by dog households, dog households earning $100,000 or more (High Income Dog Households), household income, how dog ownership compares with the national average (the Demand Location Quotient), or one number that compares areas (the Market Opportunity Score. Look at it by ZIP code or by neighborhood: small census areas of typically 600 to 3,000 people (census block groups). Layer several measures at once, and add or remove areas when the circle does not match how people actually drive to you.
Dog Household Data
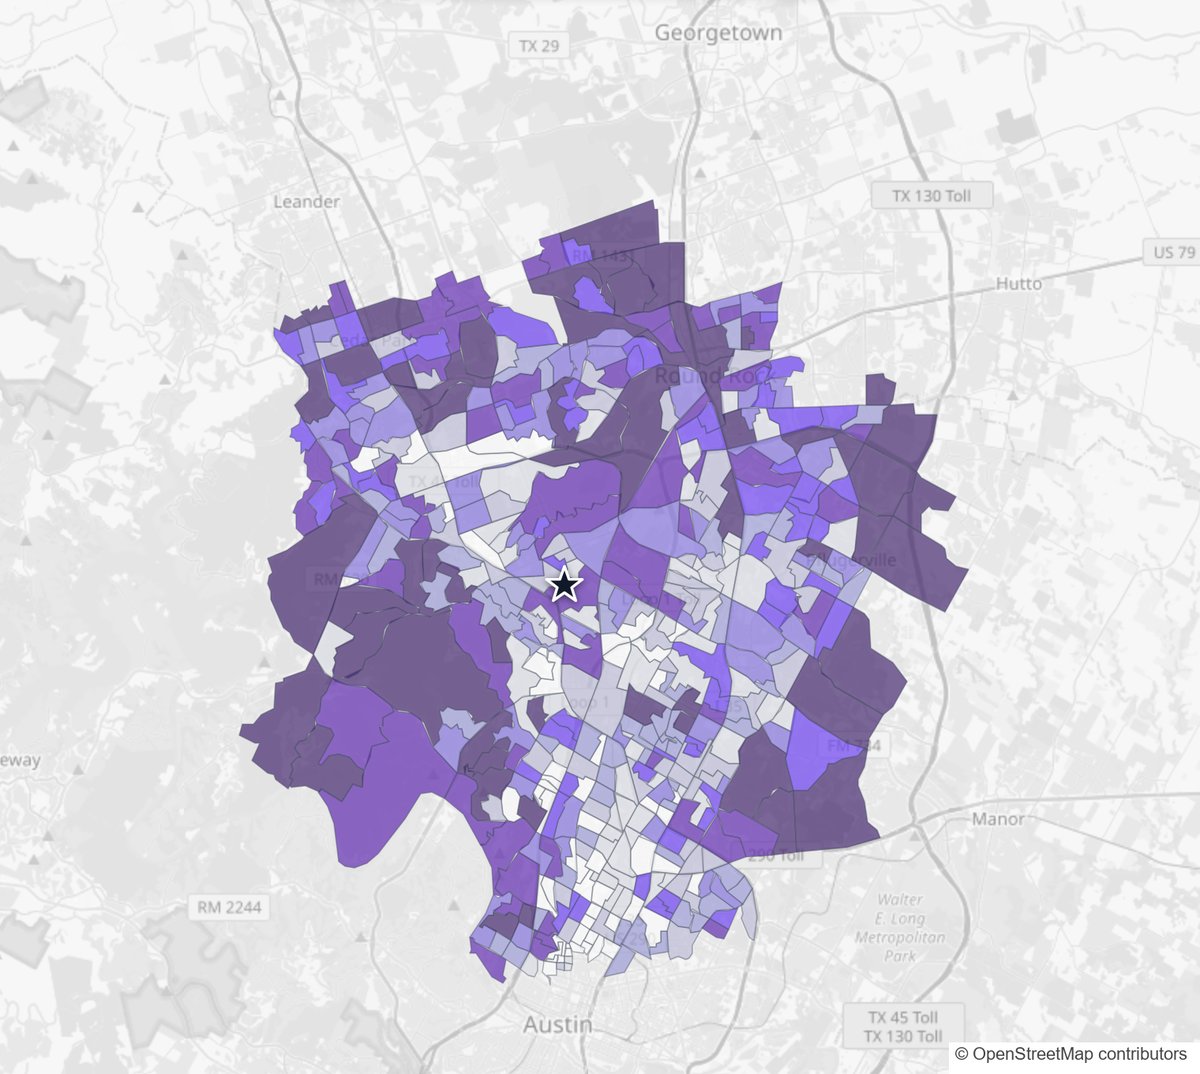
Every neighborhood in the US has a modeled count of dog-owning households and of High Income Dog Households, those earning $100,000 or more. The figures are built on US Census data, and our national total of 62.5 million falls between the AVMA and APPA figures. We call them modeled estimates every time, because no survey counts dogs.
One number per ZIP code, the Market Opportunity Score, combines demand, affluence and competing capacity, so you can put areas side by side. It is one input, not a verdict: drive time and the competition along it still decide most of the answer.
Competition
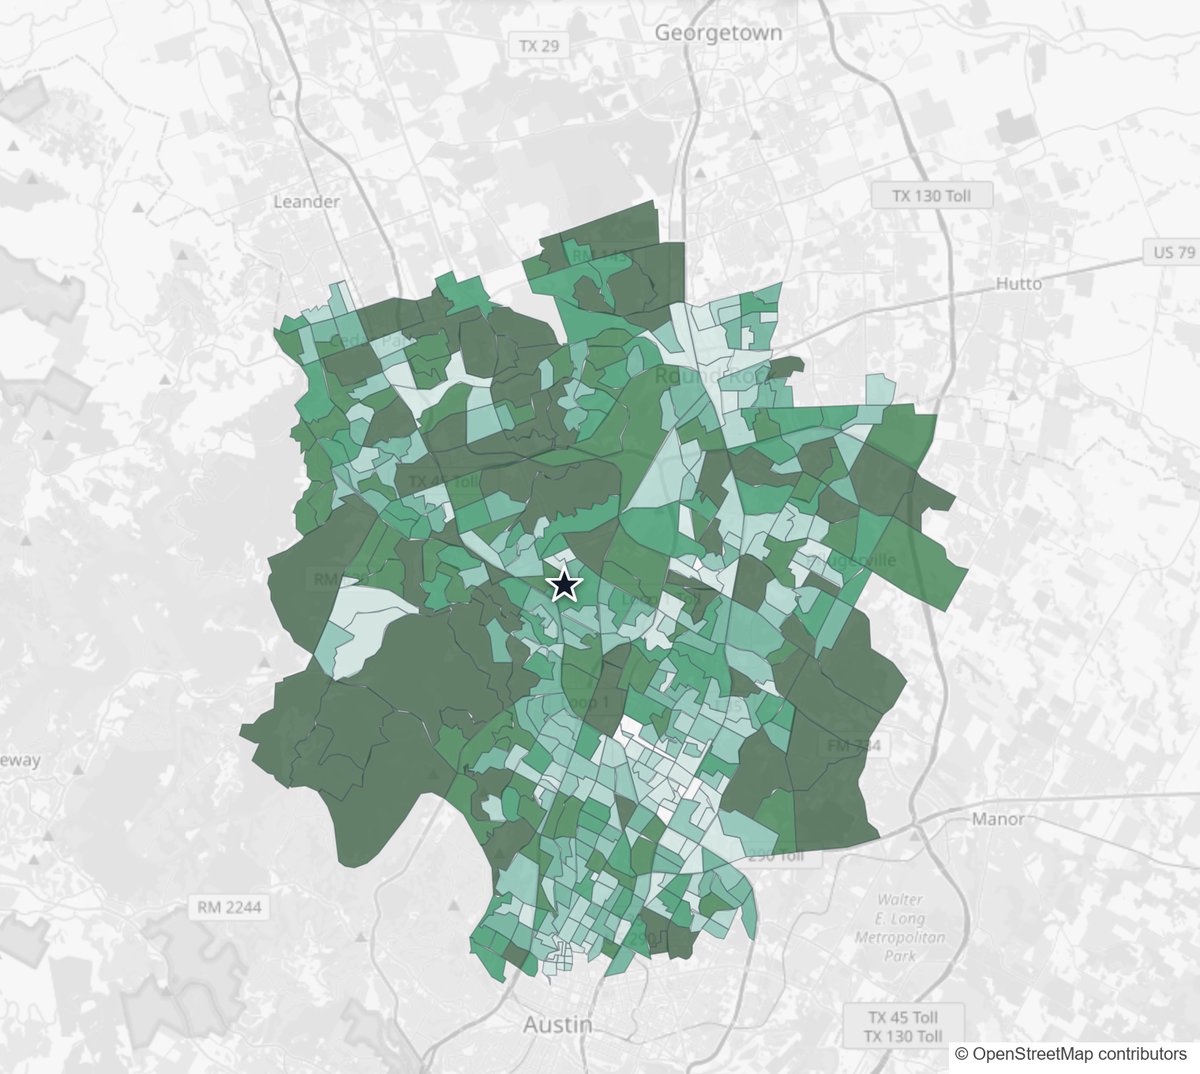
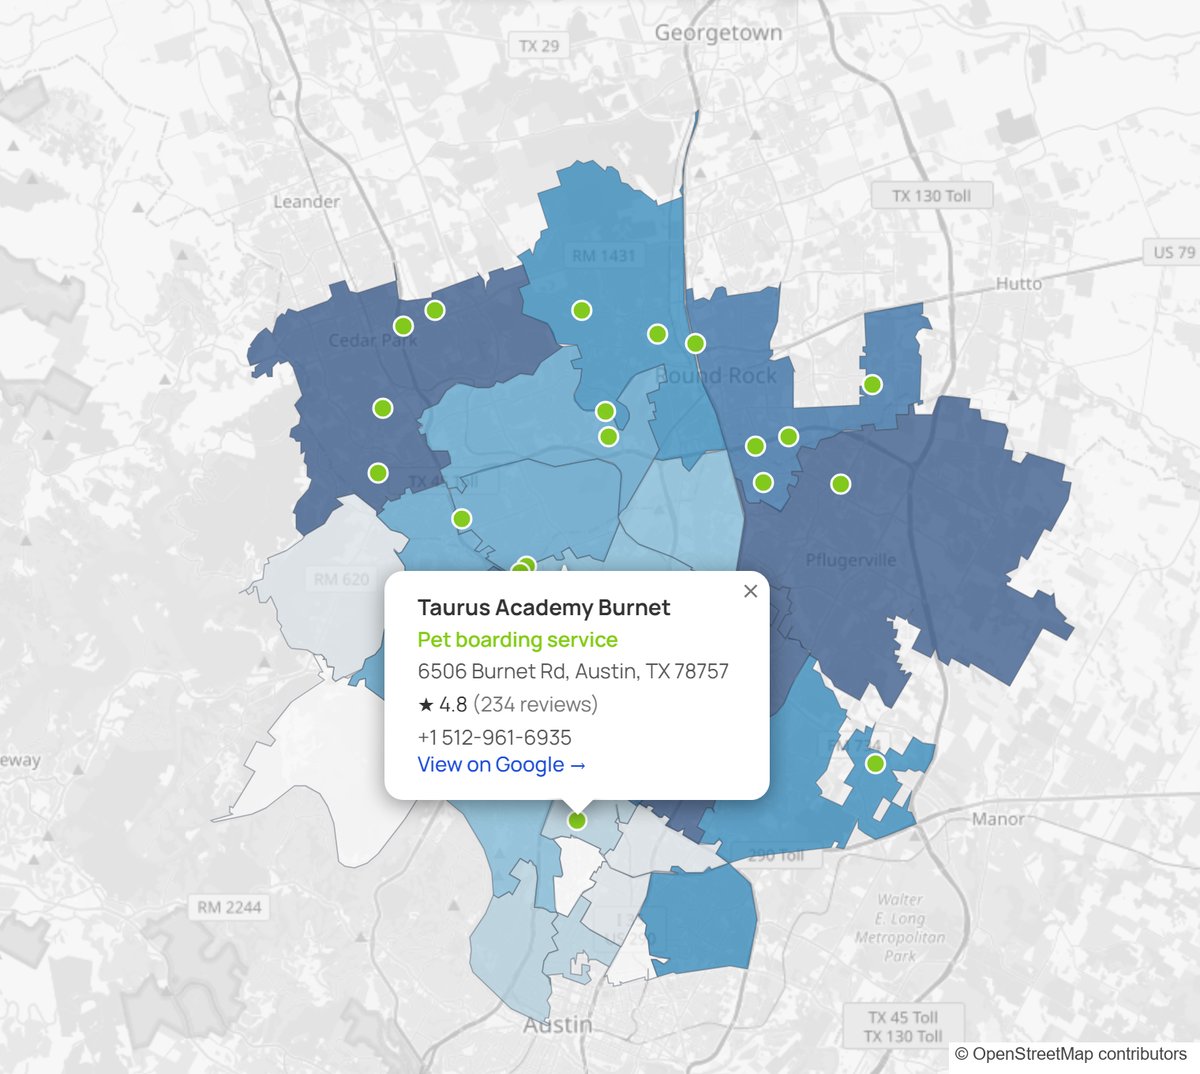
More than 20,000 boarding, daycare and kennel businesses nationwide, with how big each building is, so you see how much capacity serves a neighborhood and not just how many pins sit in it. Veterinarians, groomers and trainers appear as separate pin types. The directory is refreshed every quarter, so a new competitor shows up without waiting for a regular client to mention it.
Client Insights
Upload your client list as a spreadsheet (CSV) and the map shows, for every ZIP code and neighborhood, how many clients you have, how many of the area's dog households they are (your market share), and what they spend: average revenue and average spend over time (lifetime value). You see where you are strong, where you have barely started, and which neighborhoods look like your best ones. That is the list to aim your ads, social campaigns and direct mail at.
Local Rank Grid
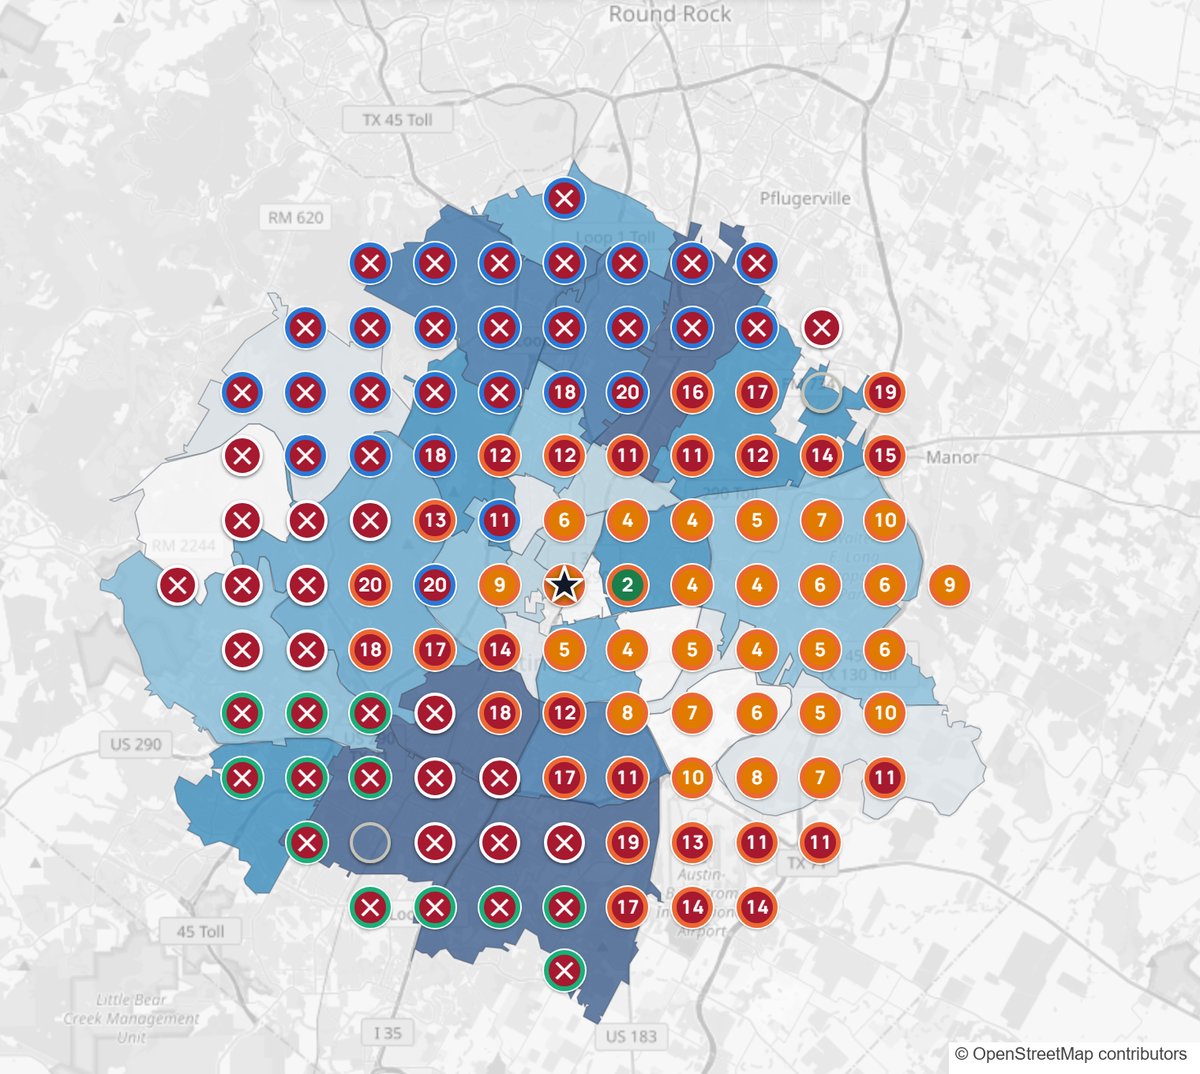
Search Google from points spread across the whole area you serve and see where you appear in the local results, the map and business list above the regular results, at each one. You see where you hold the top three, where you drop out, and who is above you at every point.
Organic Rank Grid
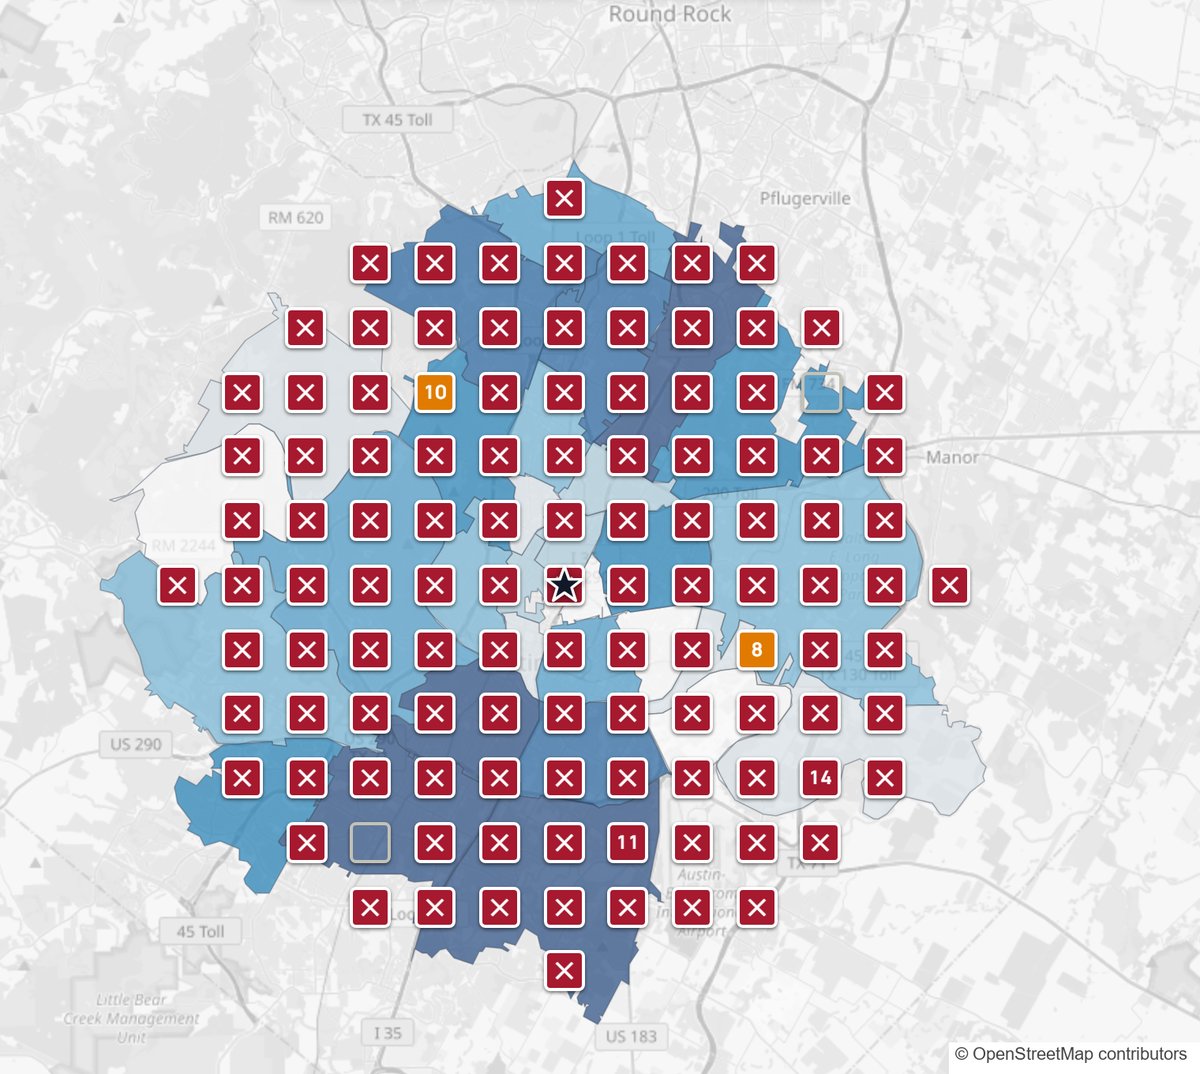
The same view for your website in Google's regular results, the list of websites below the map (Google calls these organic results), on desktop and mobile, so you can see where pet parents searching nearby find your site and where they find someone else's.
Multiple Locations
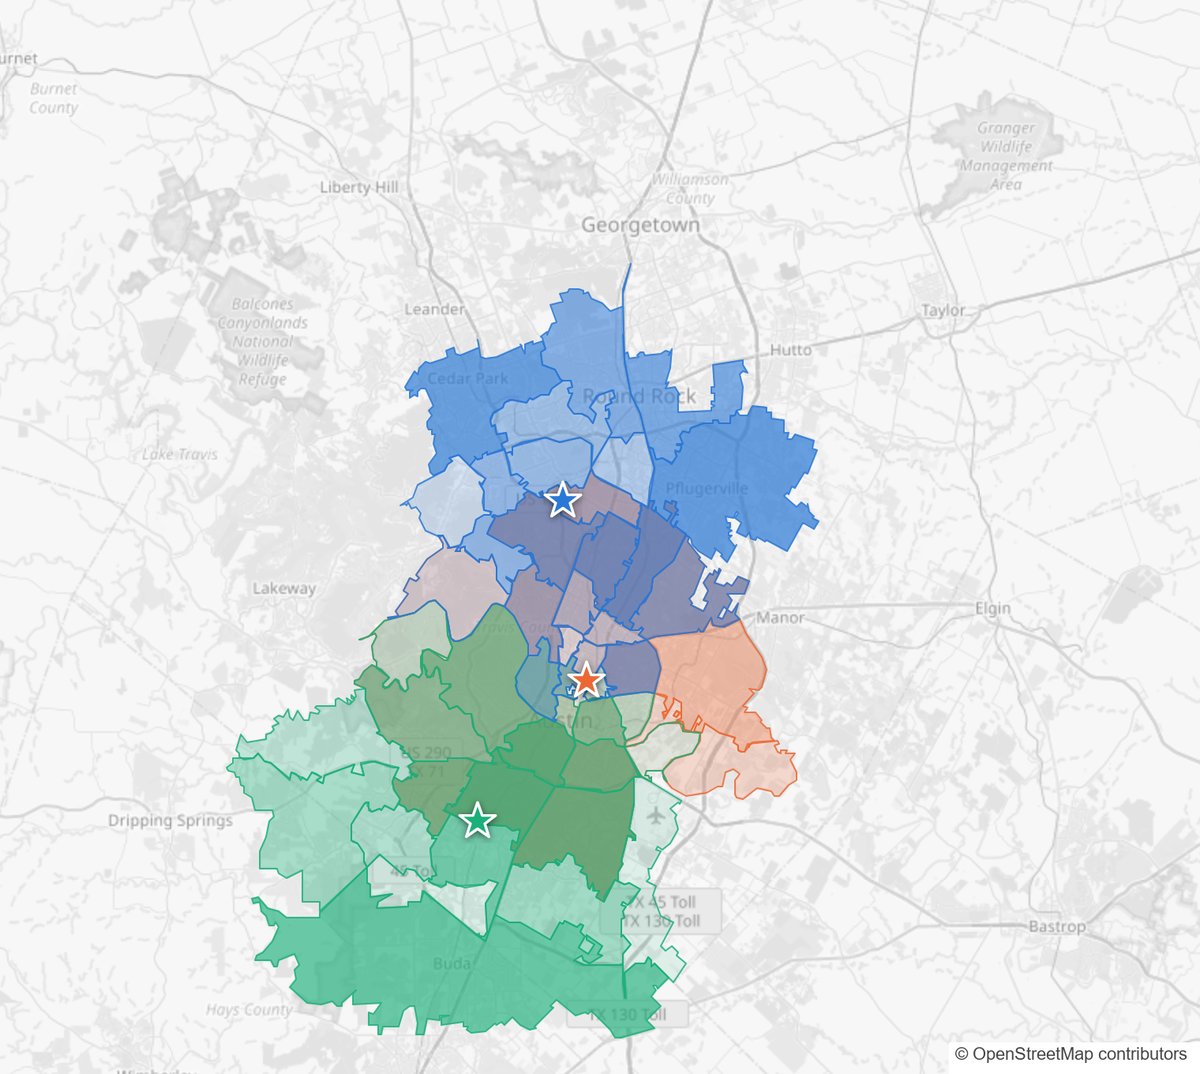
Overlay the areas your locations draw clients from to see where they overlap, give each neighborhood one owner so your own sites stop bidding against each other, and see which of your locations ranks highest in Google at each point.
Sharing and Monitoring
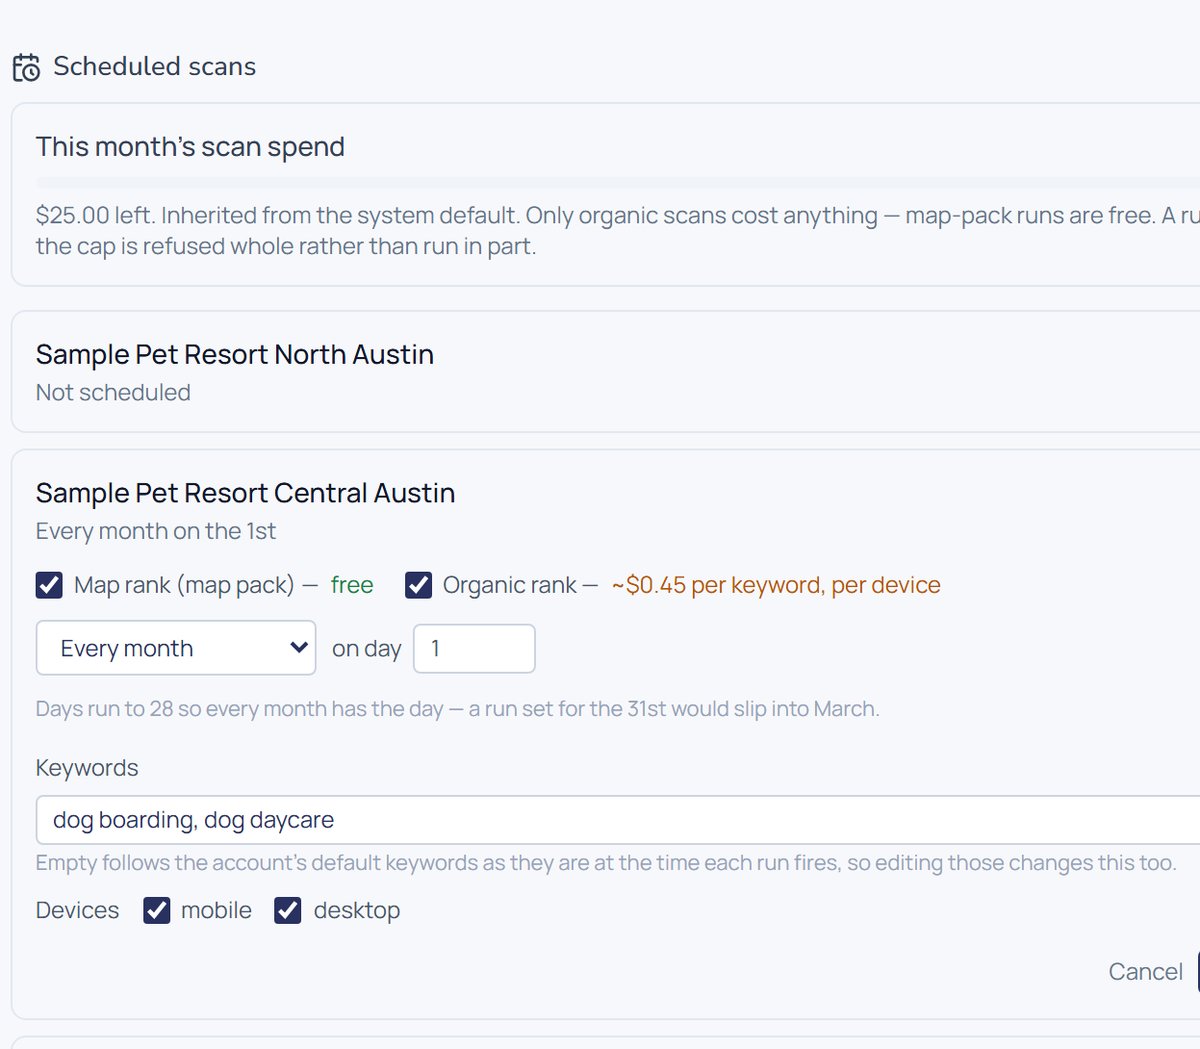
Save a map and send a link to a partner, lender or manager; they can open it without an account, and you can set it to expire. Schedule rank scans to run every month, and each month's results are kept so you can see the trend.
How Your Client File Is Handled
- Your client file is reduced to neighborhood totals. Individual clients are never shown on a map.
- A shared map shows area totals only if you choose to include them when you share it.
- Your account's maps, locations and client data are visible only to your own team.
- Account admins decide who on the team can do what.
Questions before you upload? Book a demo and we will show you the upload with a sample file first.
On the Roadmap
These are being built. Ask about early access in a demo.
Client ScreeningComing soon
Learn which clients have moved, and add household details such as homeowner or renter and presence of children to your client file. Screening will run only when you start it.
Ranked target neighborhoodsComing soon
Export your best neighborhoods as ranked lists of ZIP codes and neighborhoods, ready for ad platforms.
Lookalike neighborhoodsComing soon
Find neighborhoods that resemble the ones your best clients come from.
Quarter-over-quarter trackingComing soon
See your share of each neighborhood change, quarter to quarter.
See Your Market on One Map
We will map your market live in a 30-minute demo: households, affluence, competitors and rank. Not sure it fits your business? See who it's for.